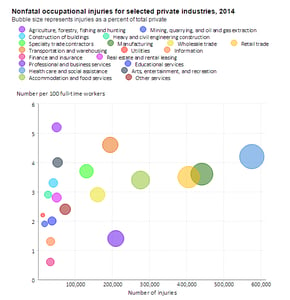
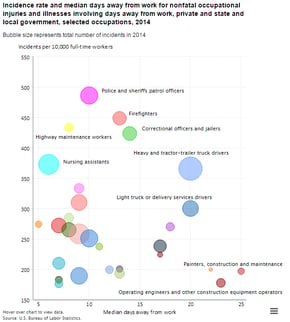
It’s that time of year again – on February 1, we will all be posting our OSHA 300A injury/illness summary. Emilcott reviewed this in a recent blog, OSHA Forms, and in following this theme, we thought it might be interesting to look at some of the data provided by the Bureau of Labor Statistics (BLS) about 2014 injury and illness incident rates.
Did you know that 75 percent of occupational injuries in 2014 occurred in service-providing industries? Or that in 2014, there were 6 occupations where the incidence rate per 10,000 full-time workers was greater than 300?
The Bureau of Labor Statistics published this information along with some statistic clarifying graphics at TED: The Economics Daily.
You may ask … Where does all of this information come from?
First – the how and what about these incident rates….
How does the BLS get the data to calculate the rates?
The data is collected in the BLS annual Survey of Occupational Injuries and Illnesses. Your organization may be requested to submit these data. The letter of request usually arrives the early in the calendar year. The survey traditionally was a mail response but now, of course, the information is entered into the survey on-line.
What and how much information is collected?
This survey is the largest surveillance system of this type in the country – the system uses a sample size of about 230,000 establishments. The requests for submission (which require a response) are sent to a variety of employer types in many different industries. The information collected is essentially that contained in the OSHA Forms 300 and 300A.
- Establishment Information - contains questions about the number of employee hours worked (needed in the calculation of incidence rates) and the average number of employees. This can be taken from the OSHA Form 300A.
- Summary of Work-Related Injuries and Illnesses - the number of injuries and illnesses by type of case. Also on OSHA Form 300A.
- Reporting Cases with Days Away from Work - detailed information on the worker and the injury or illness for cases that resulted in at least one day away from work. This information will be OSHA Form 300 with some information on the incident report (Form 301).
Next – What all the survey information used for …
What statistics are generated?
Calendar year information on the rate and number of work-related injuries, illnesses, and fatal injuries, and how these vary by incident, industry, geography, occupation, and other characteristics. Figures are calculated nationally and for 44 participating states and territories (including the District of Columbia)
How can these statistics can be used?
A high level view is that these statistics allow for detailed analyses of the magnitude, patterns, and trends in occupational injuries and illnesses. These data provide a census of both non-fatal and fatal injuries. The statistics provide a tremendous amount of information – all available at the BLS Injuries, Illnesses, and Fatalities.
Who uses these data?
The BLS includes “employers and employees, policymakers, safety standards writers, safety inspectors, health and safety consultants, and researchers are some of the most frequent users of survey data.”
Finally - Why should YOU know how your company rates align with similar companies rates and how your industry rates align with the overall incident rates …
- Although the goal is no incidents, employers should know how their sites rates compare to whose work and workforce size are similar to theirs. This can guide the direction of safety initiatives.
- Federal and State OSHA inspectors uses this rates to select which firms to visit and what hazards to look. The survey information and statistic assist inspectors in targeting industries where injuries and illnesses most frequently occur and their characteristics, survey data help.
Written by Paula Kaufmann, CIH.


